Chapter 4 Output
See the chapter on Outputs. This is a brief summary. The output are shown with the following simple fit:
Use the broom package to get the model output in tidy form. The confidence intervals shown are approximate and based on the estimated Hessian matrix. See ?tidy.marssMLE for information on how to change to a different type of confidence interval.
   term     estimate  std.error    conf.low  conf.high
1   R.R  0.223903134 0.06693408  0.09271475 0.35509152
2   U.U  0.008892986 0.05199789 -0.09302101 0.11080698
3   Q.Q  0.264706523 0.08459986  0.09889385 0.43051919
4 x0.x0 -1.241821978 0.64495962 -2.50591961 0.02227565
The get the estimated states use:
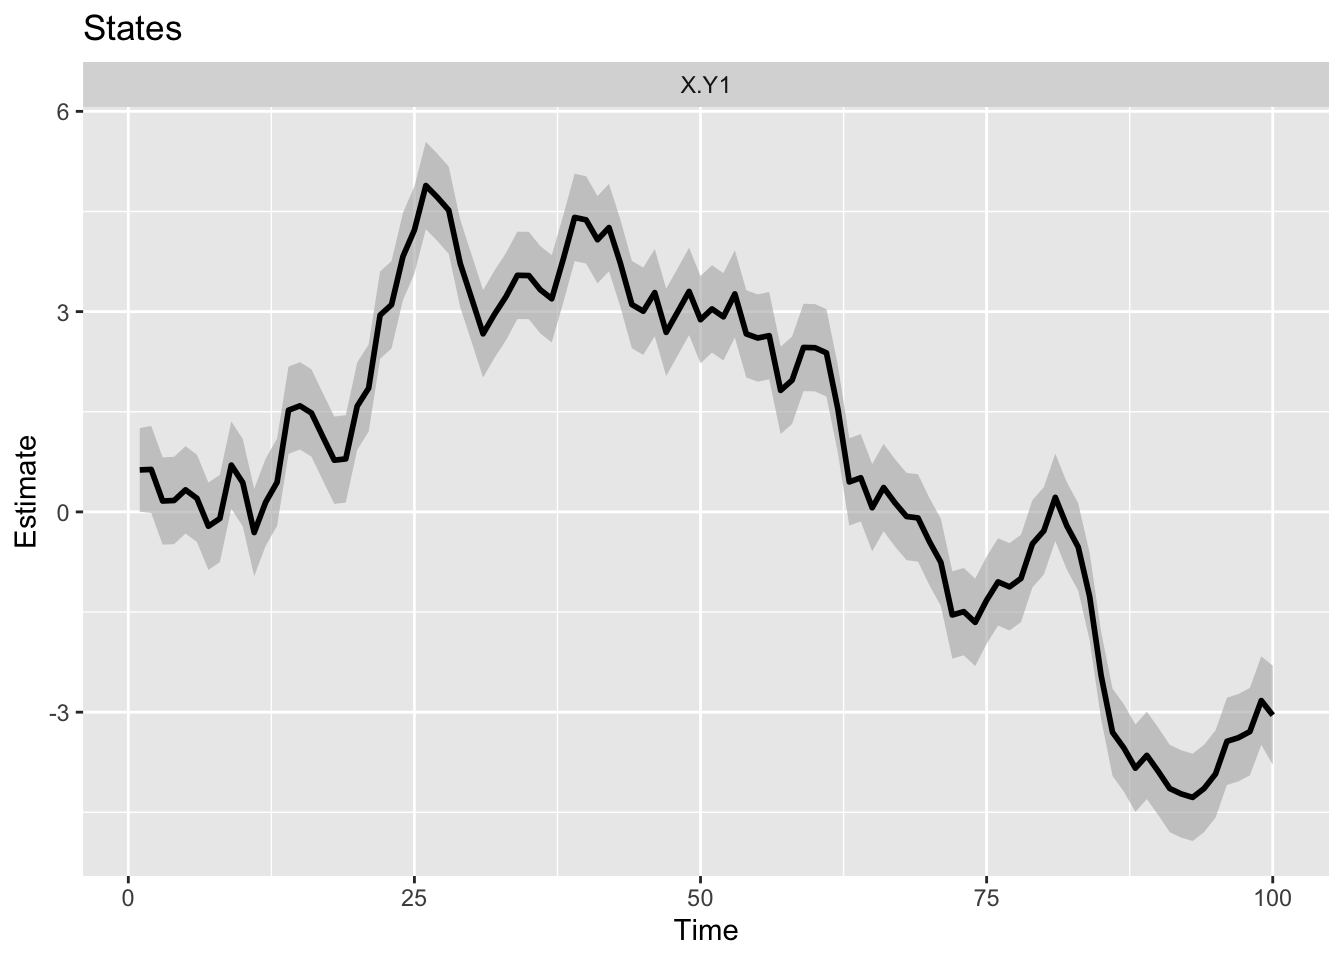
  .rownames t  estimate std.error  conf.low  conf.high
1      X.Y1 1 -1.231030 0.3059055 -1.830594 -0.6314663
2      X.Y1 2 -1.881667 0.3244581 -2.517593 -1.2457410
3      X.Y1 3 -2.245693 0.3267026 -2.886018 -1.6053672
4      X.Y1 4 -2.560529 0.3269821 -3.201402 -1.9196556
5      X.Y1 5 -2.561158 0.3270170 -3.202099 -1.9202166
6      X.Y1 6 -2.719246 0.3270213 -3.360196 -2.0782964
Note that generic rownames were given since none were specified for dat.
You can also get all the Kalman filter and smoother estimates for \(x\) from MARSSkf(). See ?MARSSkf.
The get the fitted values, the estimated \(y\), use:
  .rownames t          y  estimate std.error   std.dev  conf.low  conf.high
1        Y1 1 -0.6715577 -1.231030 0.3059055 0.5634548 -1.830594 -0.6314663
2        Y1 2 -2.1240988 -1.881667 0.3244581 0.5737388 -2.517593 -1.2457410
3        Y1 3 -2.2872995 -2.245693 0.3267026 0.5750111 -2.886018 -1.6053672
4        Y1 4 -2.8263018 -2.560529 0.3269821 0.5751699 -3.201402 -1.9196556
5        Y1 5 -2.4279706 -2.561158 0.3270170 0.5751897 -3.202099 -1.9202166
6        Y1 6 -3.1595041 -2.719246 0.3270213 0.5751922 -3.360196 -2.0782964
   pred.low  pred.high
1 -2.335381 -0.1266790
2 -3.006174 -0.7571598
3 -3.372694 -1.1186916
4 -3.687841 -1.4332164
5 -3.688509 -1.4338069
6 -3.846602 -1.5918904
There are two types of fitted values that are used in the state-space literature: the one-step-ahead which uses on the data up to \(t-1\) and the smoothed fitted values which uses all the data. Read up on fitted values for MARSS models at ?fitted.marssMLE.
To make some generic plots and diagnostic plots, you can use autoplot() in the ggplot2 package: