Chapter 8 Multivariate Models
These models can be written in the form: \[\begin{equation} \begin{gathered} \mathbf{x}_t = \mathbf{B}_t\mathbf{x}_{t-1} + \mathbf{u}_t + \mathbf{C}_t\mathbf{c}_t + \mathbf{G}_t\mathbf{w}_t, \text{ } \mathbf{w}_t \sim \,\text{MVN}(0,\mathbf{Q}_t) \\ \mathbf{y}_t = \mathbf{Z}_t\mathbf{x}_t + \mathbf{a}_t + \mathbf{D}_t\mathbf{d}_t + \mathbf{H}_t\mathbf{v}_t, \text{ } \mathbf{v}_t \sim \,\text{MVN}(0,\mathbf{R}_t) \\ \mathbf{x}_1 \sim \,\text{MVN}(\boldsymbol{\pi},\boldsymbol{\Lambda}) \text{ or } \mathbf{x}_0 \sim \,\text{MVN}(\boldsymbol{\pi},\boldsymbol{\Lambda}) \end{gathered} \tag{8.1} \end{equation}\]
Set up a plotting function for the parameters:
plot.pars <- function(fit) {
    df <- broom::tidy(fit)
    df$parameter <- sapply(df$term, function(x) {
        stringr::str_split(x, "[.]")[[1]][1]
    })
    df$parameter[df$parameter %in% c("R", "Q")] <- "R and Q"
    ggplot2::ggplot(df, ggplot2::aes(x = term, y = estimate)) +
        ggplot2::geom_point() + ggplot2::geom_errorbar(ggplot2::aes(ymin = conf.low,
        ymax = conf.up), width = 0.2) + geom_hline(yintercept = 0,
        col = "blue") + facet_wrap(~parameter, scales = "free")
}
Harbor seal data
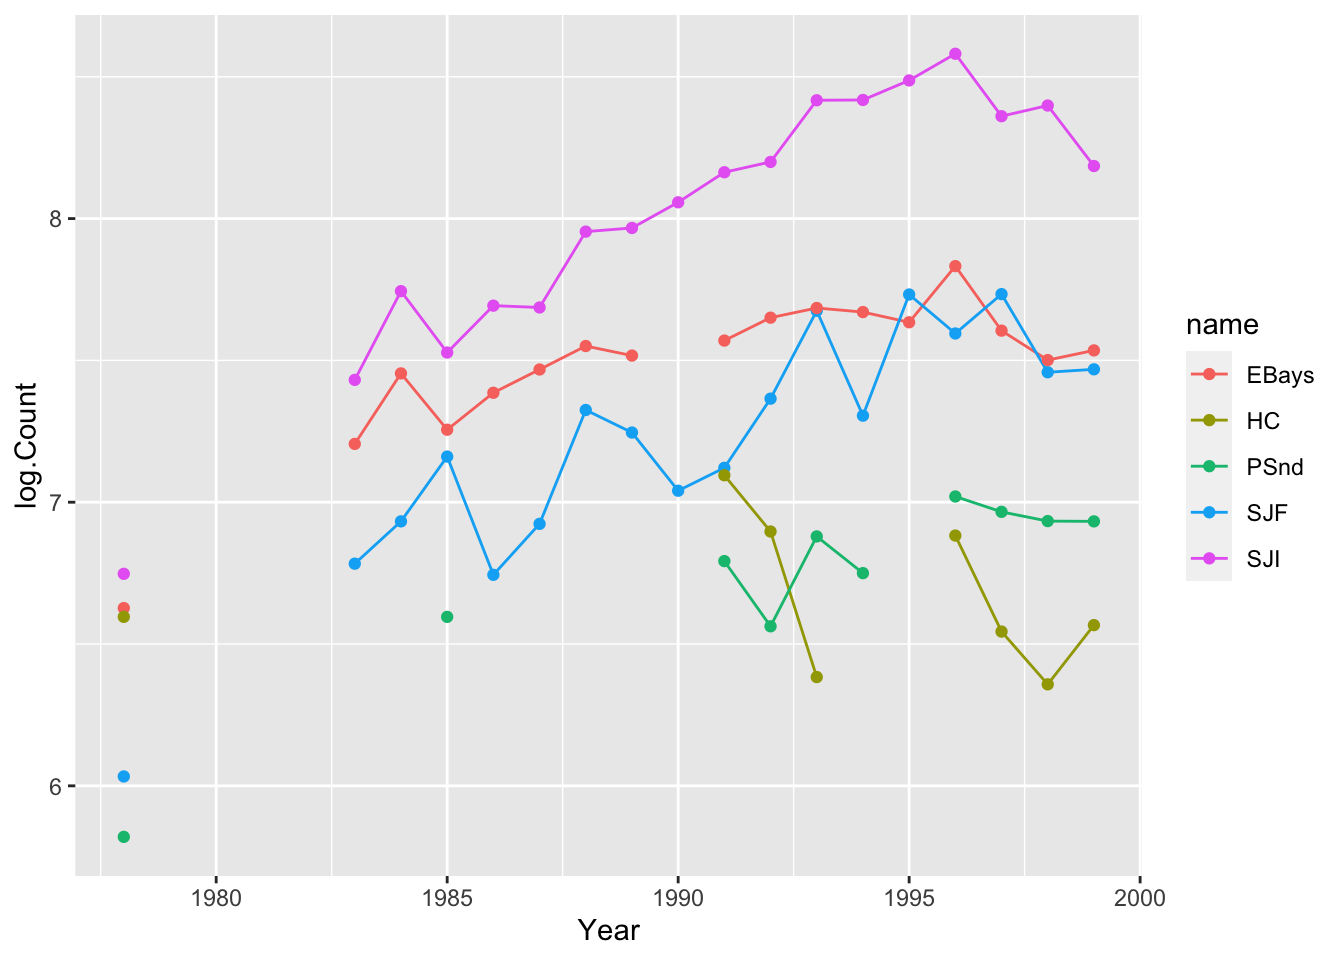
For these examples, we will use the harbor seal data set.
data(harborSealWA, package = "MARSS")
harbordf <- pivot_longer(as.data.frame(harborSealWA), cols = -Year,
    values_to = "log.Count")
ggplot2::ggplot(harbordf, aes(x = Year, y = log.Count, col = name)) +
    geom_line() + geom_point()